Repository statistics: Step-by-step guides
This page helps you to make the most of the repository statistics available in White Rose Research Online.
You can access statistics at any time at any time during your visit to White Rose Research Online by following the Statistics link in the Tools menu at the bottom of the screen.
To accompany this page we also have a more detailed Repository statistics: User guide.
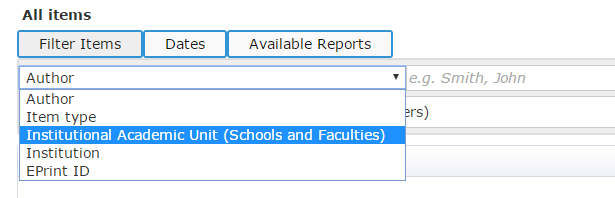
- From the Statistics Overview page select Filter Items to open the filter options

- Select Institutional Academic Unit (Schools and Faculties) from the drop-down list
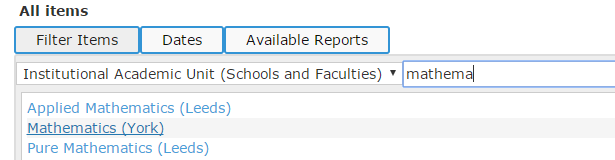
- An alphabetical list of departments and faculties will appear (please note, this includes units from all three White Rose Institutions). Begin to type the name of your department, school, centre or faculty in the box provided to limit the selection. Select the department of faculty you want to see statistics for
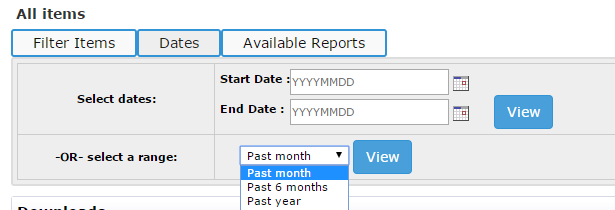
- If you want to limit your results to a particular time-period (for example, this month) Click the Dates menu and select start and end dates, or a predefined range, and click View
- Click on Available Reports and select Deposits

- The ‘Deposits (Archive)’ bar chart will show the number of outputs, by staff affiliated with your chosen academic unit, deposited each month (if your time-range only covers one month you will only see one bar). The red line overlaying the bar chart shows the cumulative average (mean) over your selected time period. Hovering your mouse pointer over a bar or the red line will show the underlying data

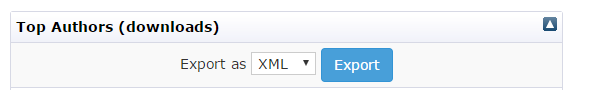
- To use the data outside of the White Rose Research Online statistics interface, click on the blue arrow symbol to the top right of the bar-chart to export the data. Select your export format from the drop-down list and click Export

- From the Statistics Overview page select Filter Items to open the filter options
- Select Institutional Academic Unit (Schools and Faculties) from the drop-down list
- An alphabetical list of departments and faculties will appear (please note, this includes units from all three White Rose Institutions). Begin to type the name of your department, school, centre or faculty in the box provided to limit the selection. Select the department of faculty you want to see statistics for
- If you want to limit your results to a particular time-period (for example, the past month) Click the Dates menu and select start and end dates, or a predefined range, and click View
- In the ‘Activity Overview’ box, the ‘Downloads’ figure will give you the total number of downloads for papers by staff affiliated with your chosen academic unit. If you have set a filter for a particular time period, this ‘Downloads’ figure will give the total number of downloads which happened within that time-period

- The ‘Downloads’ bar chart will show the number times an output by staff affiliated with your chosen academic unit has been downloaded, one bar for each month in your selected time-range (if your time-range only covers one month you will only see one bar). The red line overlaying the bar chart shows the cumulative average (mean) over your selected time period. Hovering your mouse pointer over a bar or the red line will show the underlying data

- To use the data outside of the White Rose Research Online statistics interface, click on the blue arrow symbol to the top right of the bar-chart to export the data. Select your export format from the drop-down list and click Export.

- From the Statistics Overview page select Filter Items to open the filter options
- Select Institutional Academic Unit (Schools and Faculties) from the drop-down list
- An alphabetical list of departments and faculties will appear (please note, this includes units from all three White Rose Institutions). Begin to type the name of your department, school, centre or faculty in the box provided to limit the selection. Select the department of faculty you want to see statistics for
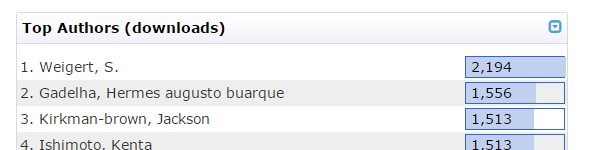
- The ‘Top authors’ box will list the 5 authors in the academic unit with the highest number of downloads from the repository. The blue bar to the right of their names show the number of times one of their publications has been downloaded
- If you want to limit your results to a particular time-period (for example, this month) Click the Dates menu and select start and end dates, or a predefined range, and click View
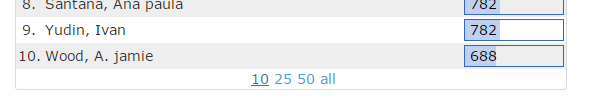
- To see more than 5 authors, select the option from the bottom of ‘Top authors’ box to view 10, 25, 50 or all authors (please note: for larger author lists this data might take a long time to generate)
- To use the data outside of the White Rose Research Online statistics interface, click on the blue arrow symbol to the top right of the bar-chart to export the data. Select your export format from the drop-down list and click Export (for large author sets the export might take some time).
- From the Statistics Overview page select Filter Items to open the filter options
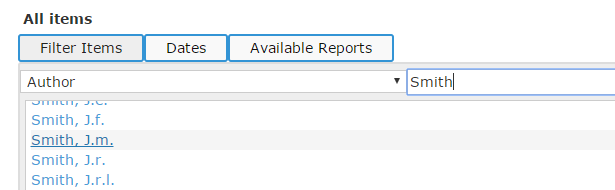
- Select Author from the drop-down list.

- In the box provided begin to type your last name. The box below will populate with a list of possible results. Select your name from the list to see the statistics for your publications.
- If you want to limit your results to a particular time-period (for example, the past month) Click the Dates menu and select start and end dates, or a predefined range, and click View.
- The ‘Downloads’ bar chart will show the number times your outputs have been downloaded from White Rose Research Online, one bar for each month. Hovering your mouse pointer over a bar will show the underlying data.
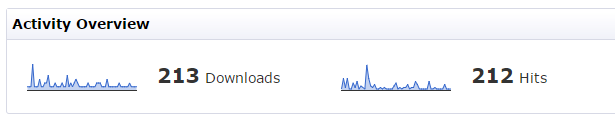
- The ‘Activity Overview’ box will show the total number of downloads recorded for all your publications in White Rose Research Online during the time period selected, as well as the the number of hits to the item page.
- The ‘Most downloaded items’ box will show your top 10 most downloaded outputs for the time period selected, as well as the number of downloads recorded for each item. To see more than 10 outputs, select the option from the bottom of the ‘Most downloaded items’ box to view 10, 25, 50 or all publications.

- To use the data outside of the White Rose Research Online statistics interface, click on the blue arrow symbol to the top right of the box containing the data you want to export. Select your export format from the drop-down list and click Export.
- To get statistics for a specific paper, you need to know the EPrint ID - a unique numerical identifier for each record in White Rose Research Online. Find the record you want statistics for using the Search or Browse options. The EPrint ID is the number found in the URL for record (e.g. http://eprints.whiterose.ac.uk/87432/). Take a copy of this number.
- From the Statistics Overview page select Filter Items to open the filter options.
- Select EPrint ID from the drop-down list.

- In the box provided add the EPrint ID copied in step 1. The box below will populate with the title of the record entered. Click on the title to view the download statistics for that record.

- If you want to limit your results to a particular time-period (for example, the past month) Click the Dates menu and select start and end dates, or a predefined range, and click View.
- The ‘Downloads’ bar chart will show the number times the output has been downloaded from White Rose Research Online, one bar for each month. Hovering your mouse pointer over a bar will show the underlying data.
- The ‘Activity Overview’ box will show the total number of downloads recorded for the selected output during the time period selected, as well as the number of hits to the item page.
- To use the data outside of the White Rose Research Online statistics interface, click on the blue arrow symbol to the top right of the box containing the data you want to export. Select your export format from the drop-down list and click Export.